
The New M&A Equation
What makes a business acquirable in the current European market?
Executive summary
A recovery that sorts assets rather than lifting them
European M&A has recovered by value much faster than it has recovered by breadth. According to LSEG, announced M&A involving European targets reached US$773bn between January and July 2026, up 78% on the prior year and the highest total for that period in nearly two decades. Mergermarket records €783bn of EMEA deal value in the first half, its strongest half on record, achieved with 10% fewer transactions than a year earlier. More capital is moving through fewer, larger deals.
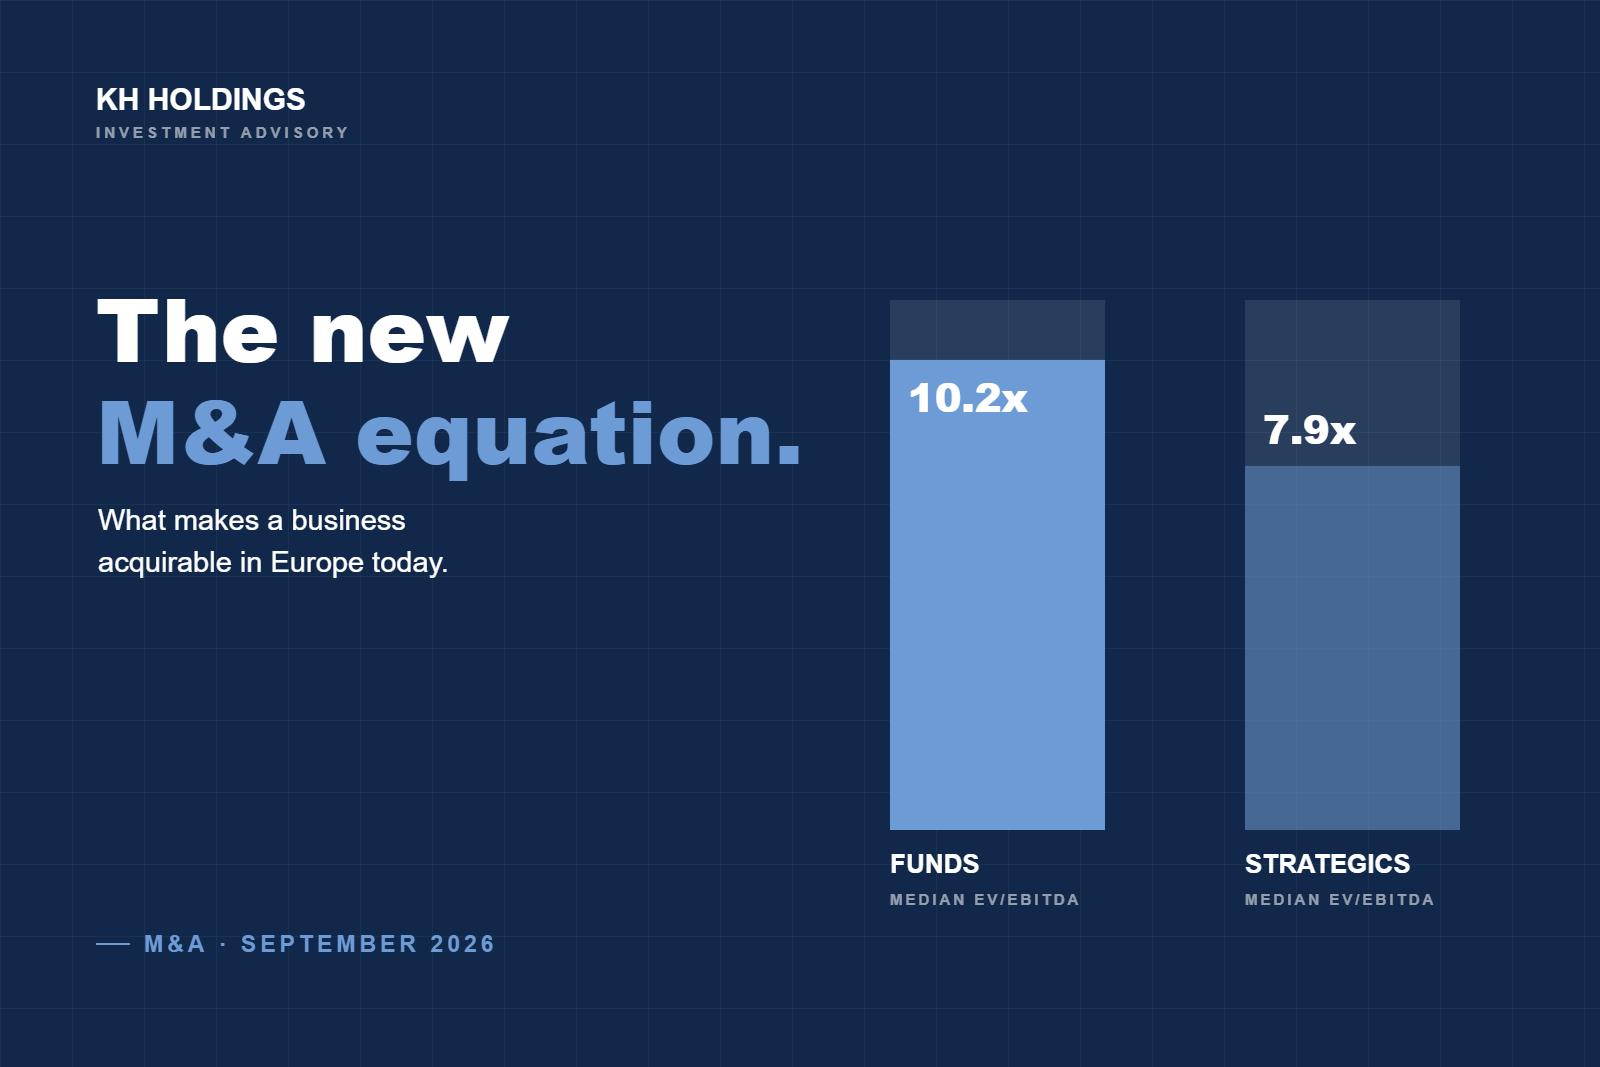
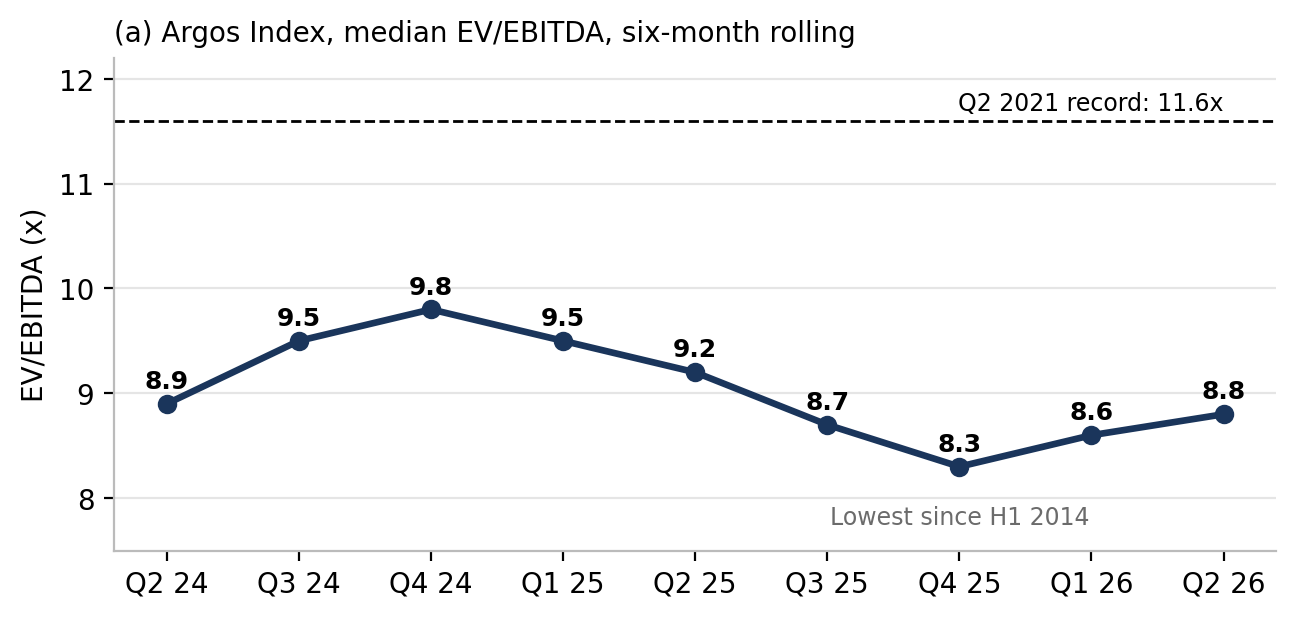
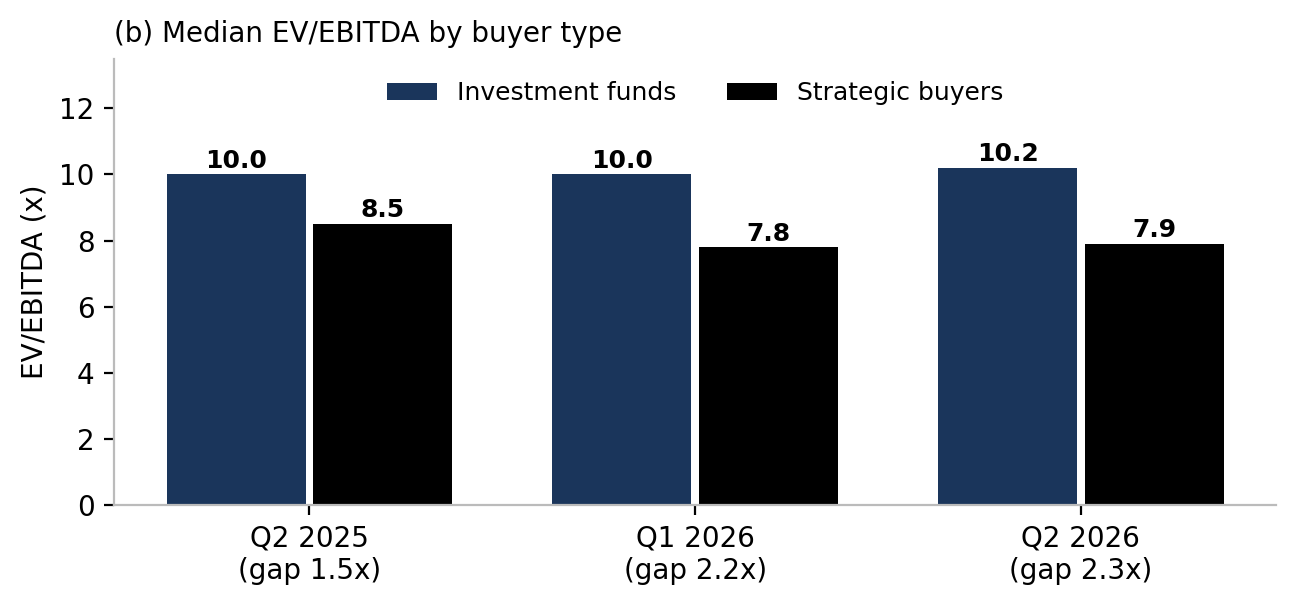
The mid-market tells a more restrained story. The Argos Index, which tracks median EV/EBITDA multiples paid for eurozone mid-market companies, fell to 8.3x in the fourth quarter of 2025, its lowest reading since 2014, and had recovered only to 8.8x by the second quarter of 2026. Beneath that median, dispersion widened. Investment funds paid 10.2x; strategic buyers paid 7.9x; the share of deals priced below 7x rose to 27%. Dealsuite's survey of 815 European mid-market advisers finds that sellers' expectations exceed realistic value in half of all sale processes, by 25% on average, and that the gap breaks the deal in 29% of those cases.
Our reading is that Europe is in a sorting market rather than a rising one. Capital is available, from corporates with strong balance sheets and from private equity under pressure to deploy, but it is being directed at a narrower set of assets: businesses with visible, cash-generative earnings, a defensible position, an obvious use to a particular buyer, and a transaction that can be financed on today's terms. Financing has become a sharper filter during 2026. The ECB has raised its deposit rate twice this year, to 2.50%, and euro area banks tightened credit standards for firms again in the second quarter.
We test an alternative explanation: that buyers are simply pricing risk more rationally after the 2021 peak. The evidence supports that explanation for the level of valuations. It does not explain their dispersion. Rational repricing would lower prices broadly. The data instead show a widening gap between assets that clear quickly and competitively and assets that cannot find a credible bid.
For mid-market owners, the practical conclusion is that being a good business is necessary but no longer sufficient. We propose a framework, the Acquirability Stack, which assesses a business on three layers: the quality of its earnings, its relevance to specific buyers, and the executability of the transaction. Headline valuation is usually the last variable settled in a deal, and it is settled on the answers to the first three.
How to read this report
Documented facts are attributed to a named dataset and period; institutional views to the organisation that holds them. Our own synthesis is marked KH analysis. Scenarios (Section 10) are conditional, not forecasts. Figures keep the currency and period of the original source.
Defining the mid-market
"SME", "mid-market" and "lower mid-market" are not interchangeable. Under the EU's SME recommendation, a medium-sized enterprise has fewer than 250 employees and turnover of up to €50m. In June 2026 the Council and Parliament provisionally agreed a "small mid-cap" category of up to 1,000 employees and €200m turnover; the EIB's mid-cap definition extends to 3,000 employees. Transaction datasets use financial thresholds: Dealsuite's mid-market covers revenue of €1m to €200m; the Argos Index covers deals with equity value of €15m to €500m. We use four approximate bands, drawn where the buyer universe changes.
| KH band | Typical revenue | Typical EV | Most likely buyers |
|---|---|---|---|
| Smaller businesses | Below €10m | Below €10m | Individuals, search funds, local trade buyers, add-on acquirers |
| Lower mid-market | €10m to €50m | €10m to €100m | Sponsor platforms buying add-ons, regional strategics, smaller funds |
| Established mid-market | €50m to €250m | €50m to €500m | Mid-market sponsors seeking platforms, international strategics |
| Larger corporates | Above €250m | Above €500m | Large-cap sponsors, listed strategics, public markets |
We concentrate on the lower and established mid-market, where selectivity bites hardest: these businesses are large enough to attract institutional buyers but rarely indispensable to any single one.
01Europe's M&A market is recovering, but not evenly
The headline numbers are strong. The UK accounted for 35% of European activity in LSEG's January to July data, and large cross-border combinations such as Kone's agreed €29.4bn acquisition of TK Elevator have added weight.
The composition matters more than the total. PwC calculates that transactions above US$5bn accounted for 48% of global deal value in 2026 to date, compared with 39% in 2025 and 26% in 2024, and that global deal value would be down 4% without them. Mergermarket's EMEA private equity data have the same shape. Buyout value rose 25.4% in the first half, but the number of buyouts fell 10.1%. The second quarter's 711 buyouts were the lowest quarterly count in years, while the mean deal size rose 41% to €111m.
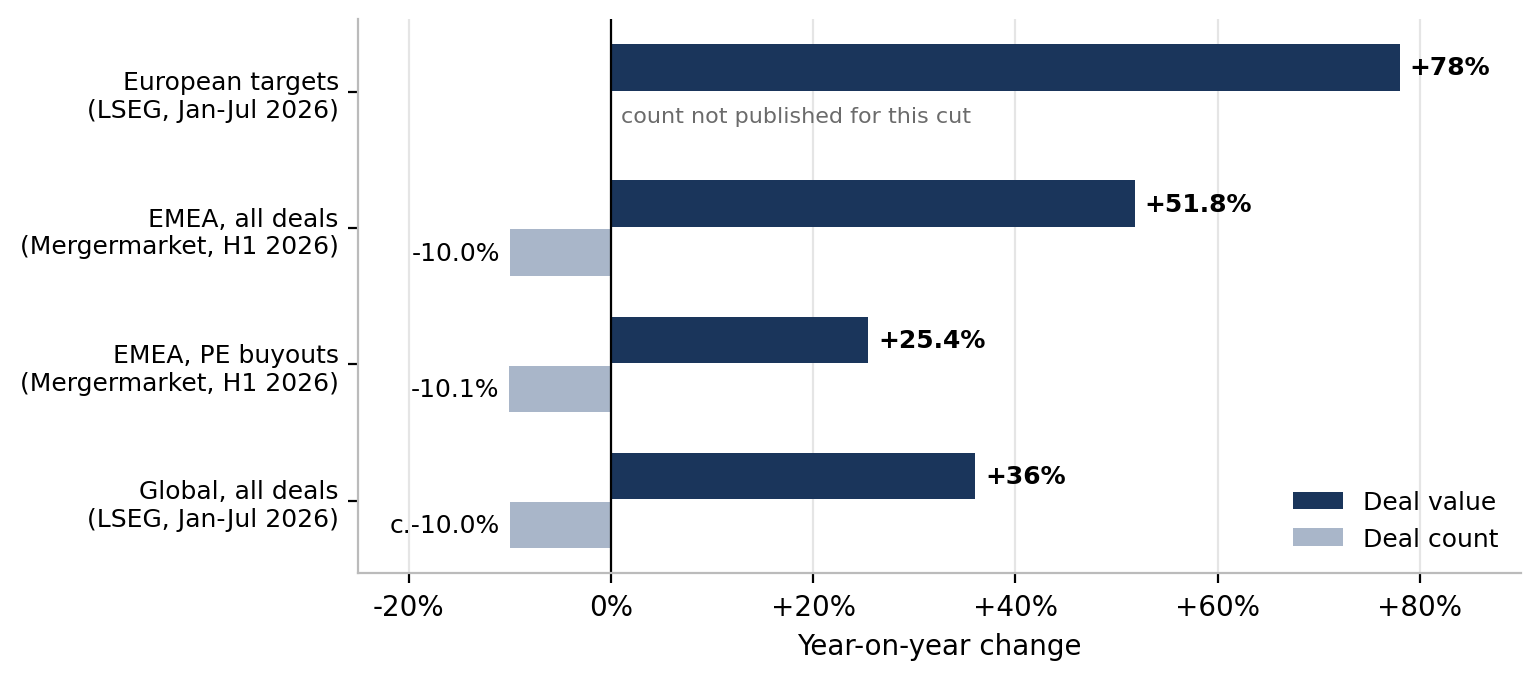
The word "recovery" therefore describes value accurately and activity poorly. Beneath the European headline sit markets moving at different speeds. A megadeal market, driven by strategic consolidation and cross-border bids, has recovered strongly. A sponsor market is deploying capital into fewer, larger and higher-quality assets while exits lag: PitchBook reports that the ratio of European PE deals to exits widened to 2.9x in the first half of 2026, the highest in at least a decade, and that 22 mega-exits accounted for 65.8% of second-quarter exit value against a ten-year average of 43.6%. The mid-market, meanwhile, is transacting a little more often, at prices close to decade lows.
Datasets disagree on the size of the market. For 2025, BCG puts European M&A at US$524bn, down 1%; Oliver Wyman at roughly US$800bn, up about 9%; A&O Shearman, with data to 1 December, at US$746bn. These reflect different definitions rather than contradictions (Table 1). We therefore prefer trends within one dataset to comparisons across several.
| Source | Scope and method | Period | Reported figure |
|---|---|---|---|
| LSEG | Announced deals, European targets | Jan to Jul 2026 | US$773bn (+78%) |
| Mergermarket (ION) | Announced deals, EMEA, Mergermarket thresholds | H1 2026 | €783bn, 9,445 deals |
| BCG | European M&A, full year | 2025 | US$524bn (-1%) |
| Oliver Wyman | Completed deals, European target and/or acquirer | 2025 | c.US$800bn (c.+9%) |
| A&O Shearman | European M&A, year to date | 2025 to 1 Dec | US$746bn |
| Argos Index / Epsilon | Eurozone majority acquisitions, €15m to €500m equity value; tracks multiples, not totals | Q2 2026 | 8.8x EBITDA (median) |
| Dealsuite | Survey of 815 advisers, companies with €1m to €200m revenue; mostly undisclosed deals | H1 2026 | 5.3x EBITDA (average) |
The mid-market data are the most relevant to this report, and they are the least exuberant. Argos reported that eurozone mid-market multiples fell to 8.3x in the fourth quarter of 2025, the weakest level since the first half of 2014, with a 22% correction in the upper mid-market. Multiples recovered to 8.6x in the first quarter of 2026 and 8.8x in the second. Argos itself attributed the first-quarter rebound mainly to a composition effect and renewed sponsor activity rather than a broad improvement in conditions. Volumes did not follow prices: estimated eurozone mid-market deal volume fell 8% quarter on quarter in the second quarter, and fund deal volume, though up 11% year on year in the first half, was 16% below the second half of 2025.
Dealsuite's adviser survey, covering smaller and largely undisclosed deals, is more positive: in the first half of 2026, 35% of advisers reported more transactions than in the preceding half-year, 20% fewer, and half reported more new mandates.
02What is driving the deal recovery?
Strategic M&A is the main engine. Bain, using Dealogic data, finds that global strategic deal value rose 36% in the first five months of 2026 while financial sponsor deal value fell 9%; in EMEA, strategic value rose 77%. Bain counts add-ons by PE portfolio companies as strategic, which matters for the mid-market: a sponsor-backed platform buying a competitor behaves, economically, like a corporate. Motives have shifted too. In 2025, 60% of strategic deals above US$1bn were "scope" deals, buying capabilities or markets rather than cost savings, the highest share Bain has recorded.
Not all drivers carry equal weight. The evidence is strongest for four:
- Consolidation of subscale industries, notably banking, insurance, telecoms and industrial equipment. Oliver Wyman estimates European corporates hold about €2.6tn in cash while many industries remain more fragmented than in the US.
- Capability acquisition linked to power, grid, automation and defence. PwC reports strategic buyers account for 86% of recent industrial manufacturing deal value, with power, automation and data-centre assets priced 15% to 30% above sector medians.
- Private equity deployment under exit pressure. Oliver Wyman estimated that over 1,500 European PE-backed assets could come to market in 2026, against a historical 700 to 800 a year.
- Generational succession. Age and lack of succession motivated 46% of mid-market sales in Dealsuite's H2 2025 survey, supplying founder-owned businesses regardless of the cycle.
Other drivers look weaker on inspection. AI is pulling capital into infrastructure and services but currently reducing appetite for many software businesses (Section 06). The energy transition supports energy deals, yet the energy shock has led banks to tighten credit most for energy-intensive manufacturing.
The strategic and financial distinction matters because the two underwrite different things. A sponsor underwrites a leveraged standalone return; a strategic buyer underwrites standalone value plus the synergy it expects to capture. When debt is expensive, sponsor returns lean on growth. Bain calculates that a buyout needing 5% annual EBITDA growth a decade ago to return 2.5x over five years now needs about 12%. That arithmetic pushes sponsors towards the most resilient, fastest-growing assets, and towards buy-and-build.
03Buyers are becoming more selective
What buyers say they want is consistent. Nordic Capital's Kristoffer Melinder told PitchBook that buyers were focused on quality, earnings visibility and credible value-creation plans. Bain observed that the deals still clearing at high prices mostly involve top-tier assets. The more useful question is whether transaction data confirm that behaviour. Several indicators suggest they do.
The distribution of prices has stretched. In the second quarter of 2026, 27% of deals in the Argos sample were priced below 7x EBITDA, up from 22%, while deals above 15x fell to 5%, a historical low. Scarcity pricing has almost disappeared; the discounted tail has lengthened.
Size is being priced as risk. Dealsuite found businesses with €10m of EBITDA selling at an average 7.2x, against 3.9x for €200,000 (Figure 8). Advisers attribute the discount to owner dependence, narrow customer bases, thin management and weaker resilience. Size is a proxy; what buyers price is dependency.
Cash conversion decides who gets financed. Valuation Research Corporation reports that European direct lending has bifurcated into competitive processes for strong credits and borrowers struggling to access the market. A business whose EBITDA does not convert reliably into cash carries less debt, and therefore commands a lower price, whatever its margin. Refinancing pressure compounds this: the ECB notes that firms' loan demand is being supported partly by refinancing and restructuring needs, and a business facing a difficult refinancing comes to market as a motivated seller.
Buyer depth is concentrated. Dealsuite reports 7.6 interested parties per company offered for sale on average, but 11.2 in IT services. Some processes draw a crowd; many draw very few serious bidders.
Customer concentration, management depth and scalability rarely appear in aggregate statistics, but advisers cite them as the reasons behind the size discount and failed processes. They reduce to one test: can a buyer underwrite these earnings without relying on a single person, customer or contract?
Testing the thesis: selectivity, or rational repricing?
The strongest counterargument is that buyers are not unusually selective; they are pricing risk rationally after a period of cheap money. The Argos Index peaked at 11.6x in 2021, ten-year euro area yields rose to 3.34% in the first quarter, the ECB has raised twice, and Bain's deal cost index is at a record. Some apparent selectivity is sector-specific (software), and some of the value recovery is a mechanical effect of a few megadeals. Parts of the market also show narrowing gaps: Dealsuite's average multiple has held at 5.3x for three half-years, with regional multiples within 0.4x of each other.
Our assessment is that repricing explains the level of mid-market valuations well and their dispersion poorly. Repricing would move prices down broadly. Instead, fund multiples rose from 8.7x to 10.2x in two quarters while strategic multiples stayed below 8x; the discounted tail of deals lengthened; buyer interest per company ranges from 7.6 to over 11 by sector; and lenders describe a bifurcated market. Both forces are at work. Repricing sets the level of the market. Selectivity decides which businesses clear within it.
04Strategic fit can change the value of a business
A business has a standalone value: the present value of its cash flows as it is run today, financed on market terms. It may also have a strategic value to a particular buyer: standalone value plus the synergies that buyer can realise, less the cost and risk of integration. The two can differ materially, and the difference is specific to each buyer. A regional distributor may be worth little more than standalone value to a financial investor and considerably more to a manufacturer seeking control of its route to market.
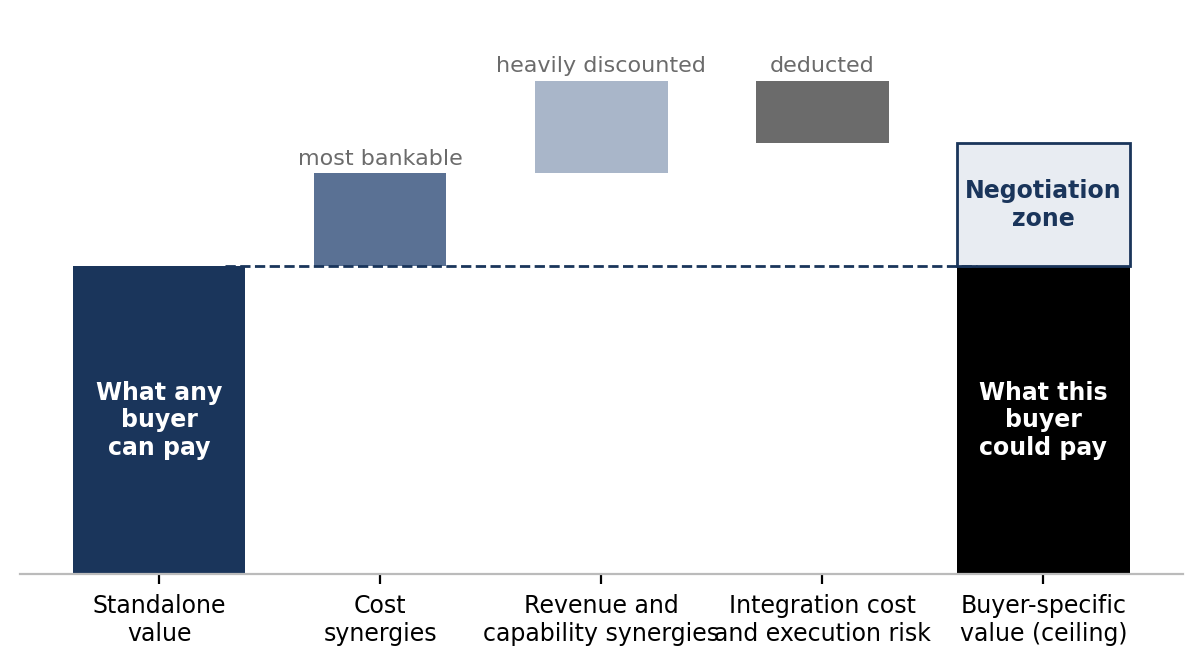
Cost synergies from procurement, overheads or site consolidation are the most bankable and most often paid for. Revenue synergies from cross-selling, distribution or geographic reach are larger in theory and heavily discounted in practice. Capability value (technology, IP, talent, permissions) is where scope deals concentrate, and supply security has gained weight since recent supply-chain disruption. Kone and TK Elevator combine several: complementary geographies, a shared shift to service revenue, and about €700m of expected annual cost savings.
Strategic value does not automatically become a higher price. Argos data show strategic buyers paying lower median multiples than funds in every quarter shown in Figure 2, and in 2025 Argos described corporate pricing as polarised, with large corporations making some opportunistic acquisitions at low prices and some strategic ones at very large premiums. Several reasons explain the pattern. Corporates pay away synergies only when competition forces them to. They apply their own hurdle rates to integration risk. Boards scrutinise dilution. And the sector mix differs: sponsors in the Argos sample concentrated on healthcare, software and B2B services, which command higher multiples.
Strategic value matters most in a narrower set of circumstances: when a target provides a capability faster than the buyer could build it; when two or more strategic buyers each see a genuine fit and compete; and when a business that is subscale on its own becomes materially more valuable inside a larger network. Outside these conditions, a seller should expect a strategic buyer to offer something close to standalone value and to keep most of the synergy for itself.
05The rise of the platform company
The most consistent pattern in European private equity is the platform model: acquire a well-run business, integrate add-on acquisitions around it, and sell a larger, more diversified group. PitchBook reports 2,121 add-on deals in the first half of 2026, a decade-high 57.7% of European PE deal count and the third consecutive quarter near record levels.
The economics are simple to describe and hard to execute. Richard Damming of Schroders Capital told PitchBook in September that a platform bought at 10x to 12x EBITDA can acquire add-ons at around 6x, which become worth the platform's multiple once integrated, and that many corporates prefer to buy an already consolidated business rather than consolidate themselves.
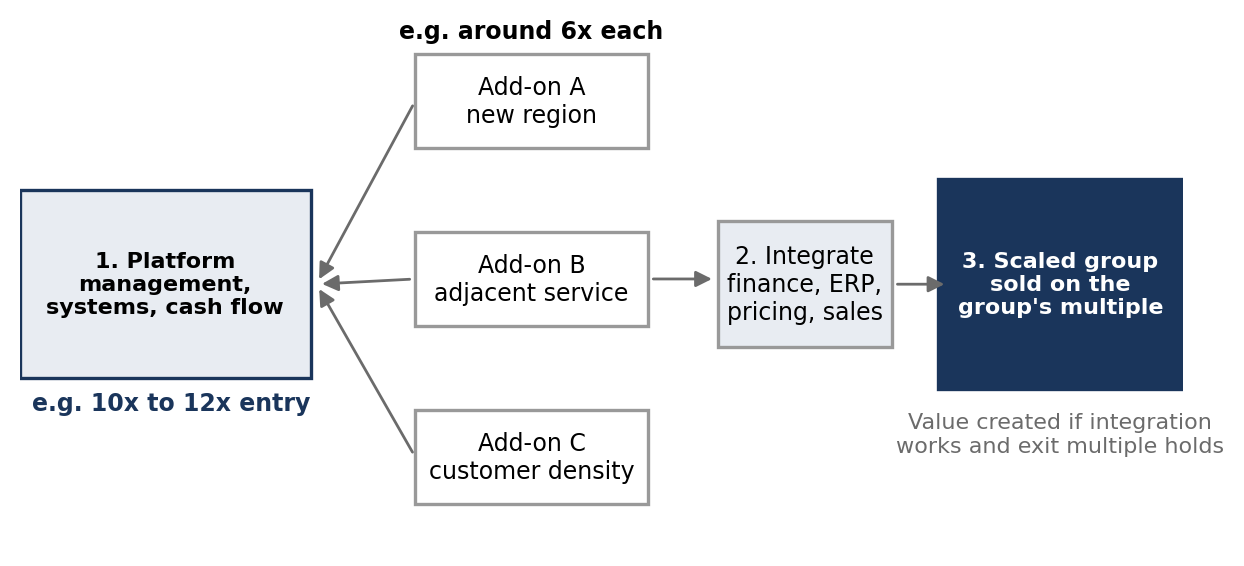
Where the model is applied is rarely glamorous. Sponsor-backed platforms in 2026 have bought in textile rental and laundry, building technology and solar installation, tank logistics and document management: fragmented markets where density and back-office scale create real economies. The model suits business services, IT services, technical services, healthcare services, specialist logistics and energy services. It suits poorly where value rests on a single product, a single founder or capital-intensive assets with little overlap.
A platform must meet a higher bar than a standalone investment. Its market must be fragmented enough to supply cheaper add-ons. Management must integrate, not just operate. Systems must absorb acquisitions without rebuilding each time. Cash generation must fund part of the programme, because debt capacity is finite; Damming notes some sponsors now use preferred equity for add-ons when leverage is maxed. The model carries its own risk: arbitrage depends on the exit multiple holding, and Argos recorded a 22% fall in upper mid-market multiples in late 2025, the very segment into which platforms are sold.
06Sector selectivity
Sector sets the size of the buyer universe before any company-specific factor applies. At the large end, LSEG data summarised by Andersen show financial services leading European deal value in the first quarter of 2026 (€83.1bn across 323 deals), with technology (674 deals) and industrials (658) leading by count.
In the mid-market, Dealsuite's data on buyer interest offer the most direct measure of appetite. The average number of interested parties per listed company is 7.6. IT services now draws 11.2, overtaking software development, which fell from 11.8 to 10.7 in a year, the steepest decline of any sector. Advisers in six of seven European regions expect business services to lead deal growth in the second half of 2026, and five expect industrial and manufacturing to follow. Retail is the only sector that every region expects to see fewer deals.
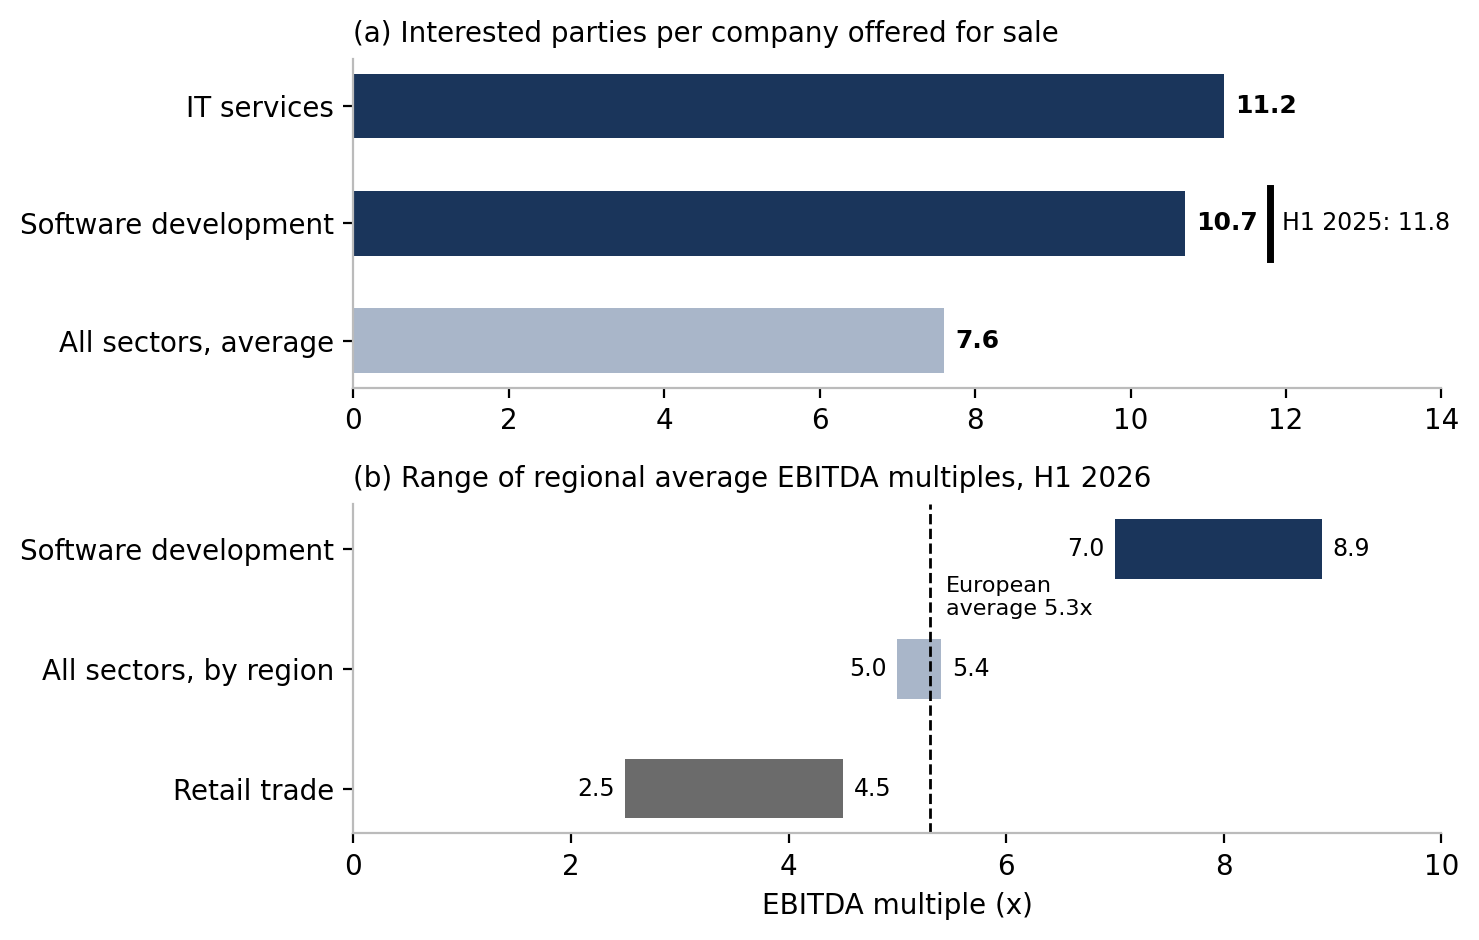
The reasons differ. IT services combines recurring managed-services revenue, demand for AI implementation and a fragmented supplier base. Software faces the opposite problem: buyers cannot yet tell which models will survive automation, and Bain reports technology buyout value has fallen sharply for that reason. Business services draws buy-and-build capital because it is fragmented, recurring and largely insulated from trade policy. Industrials splits in two: grid, automation, defence and data-centre exposure draws strategic premiums, while automotive and energy-intensive manufacturers face the tightest bank credit standards in the euro area.
The data also contain a tension worth recording. Valuation Research Corporation reports that credit spreads for European IT services and software issuers widened by more than 175 basis points after the end of 2025. M&A advisers see IT services as the most sought-after sector, while credit markets price it alongside software as exposed to AI. Where equity buyers and lenders disagree, leverage and therefore price will be constrained, even for businesses with strong buyer interest.
07Financing still sets the boundaries
A buyer may want to acquire a business and still be unable, or unwilling, to finance it on the seller's preferred terms. That distinction matters more in 2026 because European monetary policy has reversed. The ECB held its deposit rate at 2.00% from June 2025, then raised it in June 2026 as the Middle East conflict lifted energy prices and inflation reached 3.2% in May, and again in September, to 2.50%.
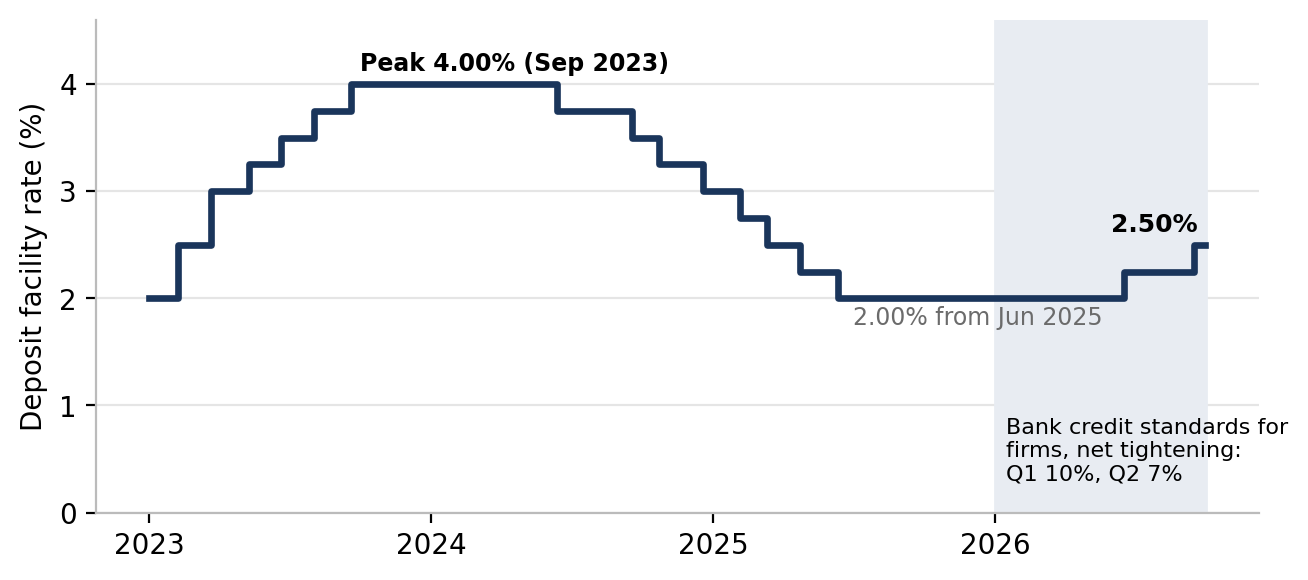
Bank credit has tightened in parallel. In the ECB's July survey, a net 7% of banks tightened standards for loans to firms in the second quarter, after 10% in the first, driven by perceived risk and lower risk tolerance, and most sharply for automotive and energy-intensive manufacturing.
Private credit has cushioned the effect. Valuation Research Corporation reports unitranche credit spreads for traditional mid-market borrowers (up to about €75m EBITDA) broadly unchanged at roughly 5.25% to 6.25%, with lender dry powder keeping terms competitive for good credits. Volumes are thinner than pricing suggests: Carlsquare, citing LCD, reports European direct lending volume down 33% year on year in the first quarter, to €8.3bn.
With Euribor close to the deposit rate, that implies an all-in cost of roughly 7.75% to 8.75% before fees (our approximation). At that cost, a business with irregular cash conversion supports materially less debt than one with the same EBITDA and predictable cash flow. Less debt means more equity per deal and, for a buyer with a fixed return target, a lower price. Financing therefore shapes transaction size (smaller deals remain bankable locally), leverage, valuation, structure and completion probability; a third of mid-market processes already take more than twelve months, according to Dealsuite.
Structure bridges the gap between willingness to pay and ability to finance. The CMS European M&A Study 2026 records more earn-outs in 2025, increasingly tied to EBIT or EBITDA. Dealsuite reports growing use of deferred payments, and advisers cite earn-outs and vendor loans as the most effective tools for closing valuation gaps; rollover equity is standard in sponsor deals. Each shifts risk to the seller. A headline price with a large deferred or contingent element is worth less than the same price paid at completion, and offers should be compared on that basis.
08What makes a business acquirable?
Buyers in 2026 ask a consistent sequence of questions, and failure at an early one cannot be repaired by strength at a later one. We organise them as the Acquirability Stack: three layers, eight dimensions.
| Layer | Question the buyer asks | Dimensions assessed |
|---|---|---|
| Executability | Can the deal be financed and completed? | Management depth; Financeability; Transaction readiness |
| Relevance | Does it matter more to a specific buyer than to the market? | Market position; Scalability; Buyer universe and strategic fit |
| Quality (foundation) | Are the earnings real and repeatable? | Financial quality; Earnings visibility |
Quality is the foundation: clean, reconciled financials, credible forecasts and explainable KPIs, plus visible earnings (recurring or contracted revenue, retention, stable margins, cash conversion). It comes first for a mechanical reason. Buyers apply their multiple to the EBITDA they believe after due diligence, not the EBITDA in the teaser. At the Argos median of 8.8x, every €0.5m removed by quality-of-earnings adjustments removes about €4.4m of enterprise value.
Relevance determines competition. Market position asks why customers choose the business and what displacing it would cost. Scalability asks whether growth can continue without proportionate cost, which is also the test of platform potential. Buyer universe asks which named buyers could create value from owning it. Sellers neglect this dimension most, yet it decides how much synergy value they capture. A business that matters to three buyers is priced by competition; one that matters to no one in particular is priced at the median.
Executability determines whether a willing buyer can complete: whether the business runs without its founder, whether its cash flows carry acquisition debt at current rates, and whether diligence can be completed without surprises. Every unresolved issue here is priced as risk, through a lower headline, an escrow, an earn-out or an insurance exclusion.
| Dimension | What the buyer is testing | Evidence that answers it | Common failure |
|---|---|---|---|
| Financial quality | Is the reported EBITDA the real EBITDA? | Reviewed accounts, reconciled monthly management accounts, quality-of-earnings work | Large, unexplained adjustments; forecasts that are routinely missed |
| Earnings visibility | Will these earnings recur under a new owner? | Contracted or recurring revenue share, cohort retention, cash conversion history | Project-based revenue presented as recurring |
| Market position | Why do customers choose this business? | Win-loss data, pricing history, customer tenure, switching costs | Growth explained only by market growth |
| Scalability | Can it grow without the cost base growing as fast? | Unit economics by site or customer, systems capacity, integration track record | Each new contract requires proportionate new overhead |
| Buyer universe | Who creates value by owning it? | A named list of strategic and financial buyers with a specific rationale for each | A generic process aimed at "the market" |
| Management depth | Does the business depend on one person? | Second-line managers, delegated customer relationships, succession plan | Founder holds key relationships and decisions |
| Financeability | Can a buyer fund this at today's rates? | Stable cash flow, predictable working capital, no near-term refinancing need | Volatile cash conversion; maturing debt |
| Transaction readiness | Can diligence be completed without surprises? | Organised data room, reviewed contracts, clean structure, vendor due diligence | Change-of-control clauses and IP issues found late |
The dimensions do not carry equal weight. On current evidence, earnings visibility and financeability carry the most weight in 2026, because they determine both the multiple and the debt available to pay it. Buyer universe carries the most upside, because it decides whether a process produces competition. Transaction readiness is the most controllable: it is largely within management's power, and it is the dimension on which a well-prepared seller most often gains ground on a larger competitor.
09The strategic value gap
Every sale process involves at least three values, and most failed processes trace back to confusion between them. Seller reference value is what the owner believes the business is worth, often anchored on a peak-cycle multiple, a peer's sale or retirement needs. Market-clearing value is standalone value to an informed buyer who must finance it at current rates. Buyer-specific value adds the share of synergies a particular buyer could rationally pay away.
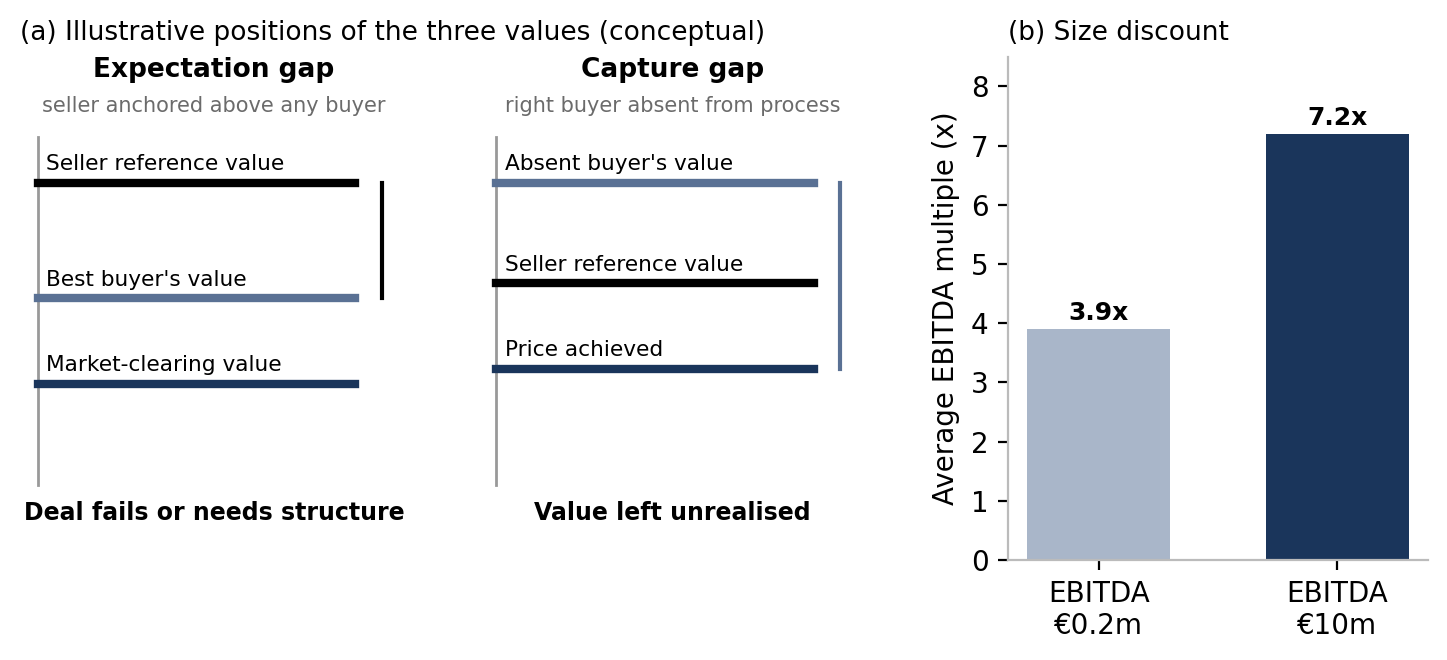
Two gaps follow. The expectation gap arises when seller reference value exceeds what any buyer can justify. It is now measured. Dealsuite's September 2026 survey finds that in 50% of European mid-market processes the seller's expectation is too high, by 25% on average, and that the gap causes the deal to collapse in 29% of those cases. The pattern varies by region: the Nordics report the highest share of overvalued sellers, at 58%; Southern Europe the highest collapse rate, at 38% of affected processes; the Netherlands the lowest, at 19%.
The capture gap is less visible and, in our view, often as costly. It arises when a buyer exists who could rationally pay more than the price achieved, but that buyer is not in the process: a cross-border acquirer overlooked by a domestic-only sale, a platform in an adjacent segment that was never approached, a strategic buyer contacted too late. Dealsuite's regional data give one indication of the opportunity. Although regional averages have converged, sector multiples still differ widely by region, with software development ranging from 7.0x in CEE to 8.9x in DACH.
This is why two businesses in the same industry can be valued very differently. Size carries a structural discount. Growth, margin and recurring revenue move a business within its sector range. Strategic fit decides whether anyone pays above market-clearing value, and financing cost caps what a leveraged buyer can pay regardless. Precedents need care: 2021 transactions were priced on a cost of capital that no longer exists, and listed multiples need size and liquidity adjustments. Revenue multiples help mainly for high-growth recurring businesses whose EBITDA understates their economics.
10What the next 12 to 24 months could look like
The outlook turns on genuinely uncertain variables: energy prices and inflation, the ECB (next decision 29 October), US trade policy, the pace of PE exits and AI's effect on specific business models. We set out conditional scenarios rather than a forecast.
Selective continuation. If rates plateau near current levels and the energy shock fades slowly, the present pattern is likely to persist: large strategic transactions continue, mid-market volumes edge higher as succession-driven and sponsor-driven supply comes to market, and dispersion in pricing remains wide. Earn-outs and deferred consideration remain common. This is the scenario most consistent with current adviser sentiment; 82% of Dealsuite's respondents describe themselves as optimistic about the second half of 2026.
Broadening. If inflation falls back, the ECB pauses, and exit routes reopen, recycled capital from exits would allow sponsors to raise funds and deploy more broadly. Upside catalysts exist: the IPO market has shown signs of life, the exit backlog is large, and fiscal commitments on defence and infrastructure, including Germany's €500bn infrastructure fund, create sustained demand in parts of the industrial economy. In this scenario the quality premium would narrow somewhat, and mid-market multiples could move back towards the levels of 2024.
Tightening. If energy prices rise again and the ECB continues to tighten, banks would likely tighten credit standards further, as they already expect to in most sectors. Financeability would become the binding constraint. Businesses with refinancing needs would come to market as motivated sellers, the discounted tail of the valuation distribution would lengthen, and lower-quality assets would struggle to transact except at distressed prices.
Some factors hold across all three: succession will keep adding supply, private credit will remain competitive for good credits, and AI will keep moving capital towards physical infrastructure and services. France may lag ahead of its 2027 elections; it was the only region in Dealsuite's survey where optimism fell. In every scenario, businesses at the top of the Acquirability Stack transact. What varies is the price of everything else.
Conclusion
What makes a business acquirable in the current European market?
Valuation still matters. But in a market where capital is plentiful and selective at the same time, headline valuation has become the result of a negotiation that turns on other questions. Buyers increasingly need clear answers to five of them.
Why this company? What does it do that customers value and competitors cannot easily replicate? Why now? What in the business's position or its market makes this the moment to own it? Why this buyer? Who, specifically, is better placed than the market to own it? What value can the buyer create? Which synergies or growth are real, and how much of them will the buyer pay away? Can the transaction be financed and executed? Will the cash flows carry today's cost of debt, and can diligence be completed without surprises?
The European evidence of 2026 suggests that businesses able to answer all five attract competitive interest even in a difficult financing environment, and that businesses unable to answer them struggle even when capital is abundant. Being a good business is necessary. In a more selective M&A market it is not sufficient. A business must also be understandable, strategically relevant, financeable and executable from the perspective of the right buyer.
At KH, this is where we spend most of our time: before a process begins, on the questions that decide how it ends.
Sources and research notes
All figures are as reported by the named source for the stated period. Charts were drawn by KH Holdings from published data; conceptual figures are labelled. Where sources use different definitions, we report each on its own terms (see Table 1). Data gathered to 18 September 2026.
Transaction and valuation data
- LSEG Deals Intelligence, Global M&A update: a record-breaking market that's becoming increasingly concentrated (August 2026).
- LSEG, Separating the signal from the noise: M&A booms in early 2026 (May 2026).
- Investment Executive, Mega deals drive global M&A record, reporting LSEG H1 2026 data (July 2026).
- ION Analytics / Mergermarket, Deal Drivers: EMEA HY 2026 (August 2026).
- PitchBook, Q2 2026 European PE Breakdown; European PE's exit backlog hits decade high (July 2026); In a stalled exit market, sponsors are consolidating their way out (September 2026); PE's cautious optimism on European dealmaking for 2026 (January 2026).
- Argos / Epsilon Research, Mid-market Argos Index Q2 2026 (3 September 2026); Q1 2026; Q4 2025; Q3 2025; Q2 2025; Q4 2024; Q3 2024; Q2 2024. Q1 2025 figure (9.5x) from the Argos newsroom. Q1 2026 full report: PDF.
- Dealsuite, European M&A Monitor September 2026 and press release (3 September 2026); European Monitor March 2026. Methodology: surveys of 815 and 848 advisory firms respectively, companies with revenue of €1m to €200m.
- CMS, CMS European M&A Study 2026 (deal terms for 2025 transactions advised by CMS).
Advisory and bank research
- Bain & Company, M&A Midyear Outlook 2026: A Winner's Paradox; Private Equity Midyear Report 2026; Looking Back at M&A in 2025. Bain's strategic M&A includes PE portfolio add-ons; Dealogic data.
- PwC, Global M&A industry trends: 2026 mid-year outlook (LSEG data to 31 May 2026). Industrial manufacturing figures as reported by MarketScale citing PwC.
- BCG, M&A Outlook 2026: Expectations Are High, Again (January 2026).
- Oliver Wyman, Top 10 big deal trends that will shape European M&A in 2026 (January 2026).
- A&O Shearman, Transactional activity in Europe gains momentum heading into 2026.
- Andersen Italy, M&A and Private Equity in Europe: Q1 2026 (LSEG data).
- Reed Smith, UK and European M&A in 2026: the story so far (Mergermarket and S&P data).
- European Business Magazine, Inside Europe's biggest M&A deals of 2026 (Kone and TK Elevator terms).
Financing and policy
- European Central Bank, Key ECB interest rates; monetary policy decisions of 30 April 2026 and 23 July 2026; September 2026 rates.
- European Central Bank, July 2026 euro area bank lending survey and full report.
- Euronews, reporting ECB decisions of 11 June 2026 and 23 July 2026 (inflation data).
- Valuation Research Corporation, European Private Market Trends: Q2 2026.
- Carlsquare, European Debt Markets: Quarterly Insights #2 2026 (LCD data).
- European Parliament, Simplified rules for small mid-cap companies; European Family Businesses, Small mid-caps: provisional agreement reached (9 June 2026). SME thresholds per Commission Recommendation 2003/361/EC.
Research notes
- The all-in unitranche cost range in Section 07 is a KH approximation (deposit rate plus reported credit spread) and excludes fees and original issue discount.
- The enterprise value sensitivity in Section 08 is simple arithmetic (€0.5m multiplied by the 8.8x Argos median) and is illustrative.
- Examples of platform add-ons in Section 05 are drawn from sponsor announcements on the Argos newsroom (2025 to 2026) and are cited as illustrations of activity, not of returns.
KH Holdings Research. This publication is for information only and does not constitute investment, legal or tax advice, or an offer or solicitation in respect of any security or transaction. Data are drawn from third-party sources believed to be reliable but not independently verified.
Considering a sale or acquisition?
We work with owners before a process begins, on the questions that decide how it ends.