
The Capital Gap
Why Europe’s Mid-Market Businesses Are Struggling to Access the Right Capital
Executive summary
European capital markets are not short of money. In the first half of 2026 EMEA generated €783 billion of announced M&A, the strongest half-year for aggregate value on record. European private equity and venture capital firms raised €147 billion during 2025, the second-highest annual total ever. European private credit assets under management now exceed €400 billion. Bank lending to euro area non-financial corporations grew at 4.4% in the year to July 2026, the fastest pace in three years.
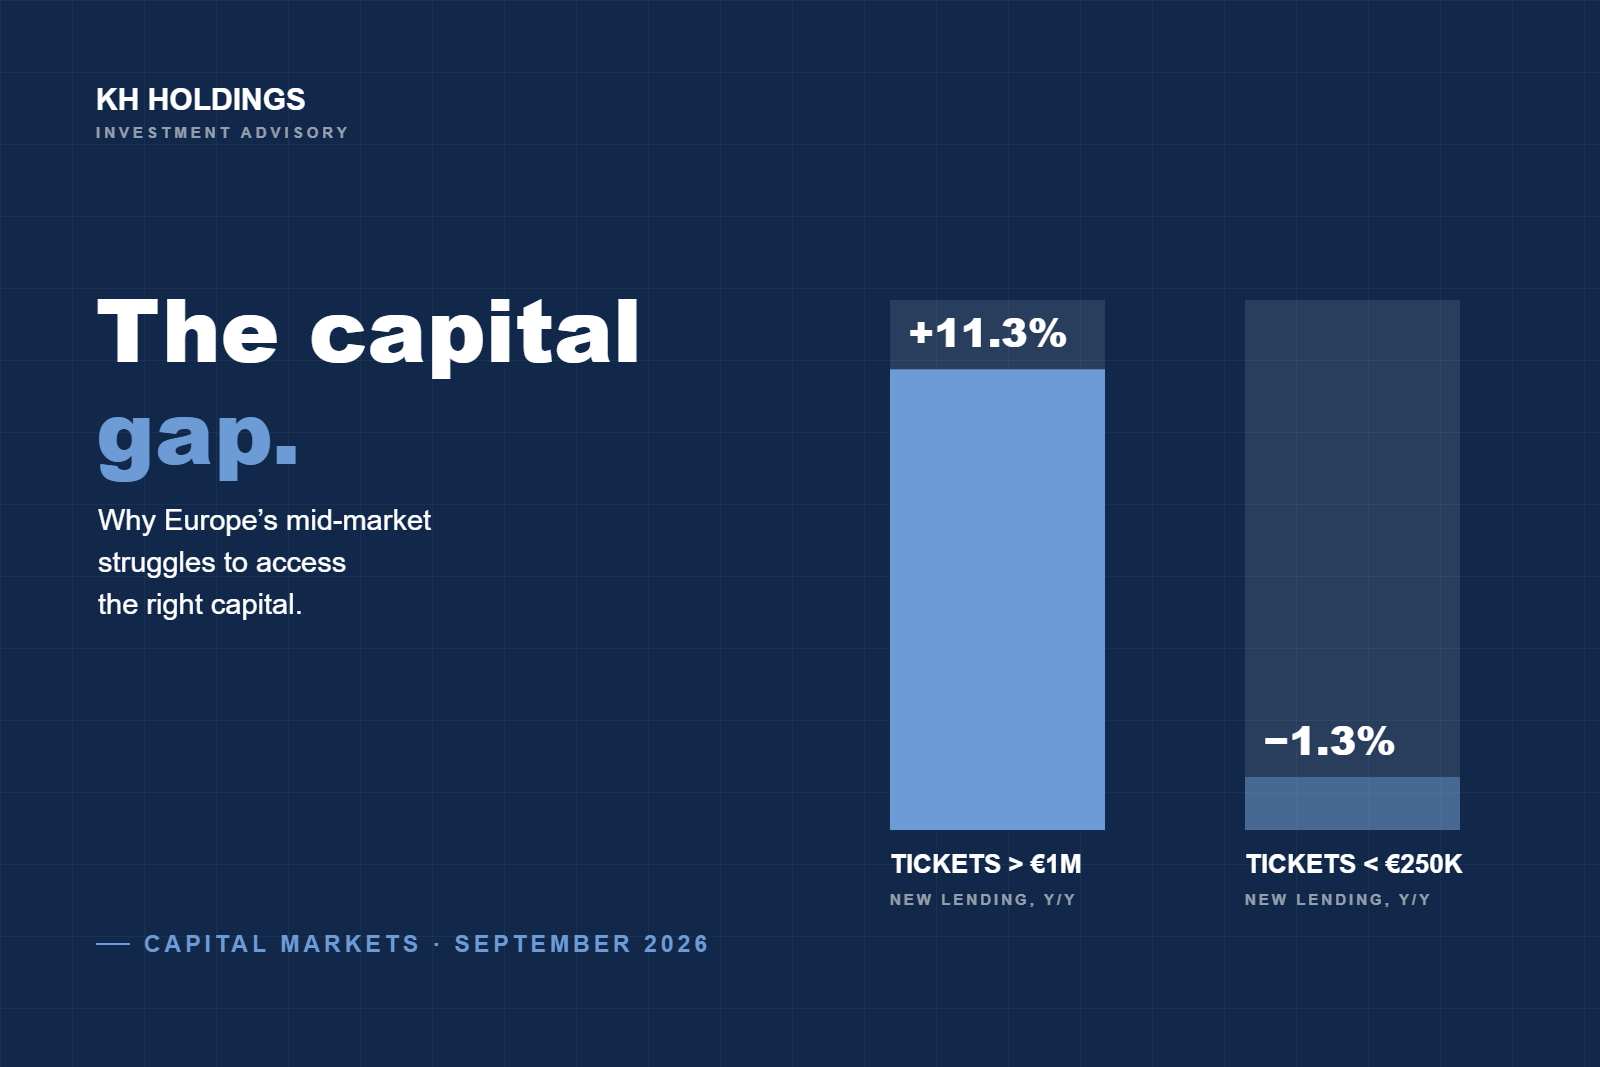
Underneath those aggregates, the distribution has changed. EMEA deal volumes fell 10% year on year in the first half of 2026 even as values rose 51.8%. Buyout counts fell 10.1% while the mean deal size climbed 41% to €111 million. In the second quarter of 2026 the ECB's Survey on the Access to Finance of Enterprises recorded large firms reporting improving bank loan availability (a net 4%) at the same moment SMEs reported further deterioration (a net -4%), with the bank loan financing gap widening for SMEs to a net 5% while remaining at a net 1% for large firms. Euro area new lending in tickets above €1 million grew 11.3% year on year in July 2026. New lending in tickets below €250,000 fell 1.3%.
The evidence supports the proposition that Europe's difficulty is one of allocation rather than quantity, but it supports it with an important qualification. The gap is not primarily a price gap. In July 2026 the euro area rate on small floating-rate loans stood at 3.83% against 3.49% on large ones, a differential of only 34 basis points. Capital is not being withheld from mid-market companies at punitive cost. It is being routed around them.
The routing is visible in valuation dispersion. The Argos mid-market index recovered to 8.8x EBITDA in the second quarter of 2026 from a decade low of 8.3x in the fourth quarter of 2025, but the recovery masks divergence: multiples paid by investment funds reached 10.2x while strategic buyers held at 7.9x, and the share of transactions priced below 7.0x rose to 27%. Median stability and tail widening are occurring simultaneously.
This publication distinguishes capital availability from capital accessibility. Availability is a market condition. Accessibility is a company-level outcome determined by whether a business can be underwritten efficiently by the investors whose mandate actually fits it. Where investors face a record 32,000 unsold portfolio companies globally and distributions below 15% of net asset value for four consecutive years, underwriting capacity, not capital, is the binding constraint. The businesses that clear are those that are cheap to diligence, credible to committee and correctly matched to the instrument they are asking for.
Definitions and scope
Terminology in this field is loose, and the looseness is not accidental. Europe does not have a settled statistical definition of the segment that sits between the SME and the large corporate. The Draghi report on European competitiveness observed directly that the EU lacks a commonly agreed definition of small mid-caps and readily available statistical data on them. The segment most exposed to a financing mismatch is, in a literal sense, the least measured.
The definitions in current use diverge materially:
| Definition | Threshold | Source |
|---|---|---|
| SME | Fewer than 250 employees; turnover ≤ €50m or balance sheet ≤ €43m | EU Recommendation 2003/361/EC |
| Small mid-cap (proposed) | 250 to 749 employees; turnover ≤ €150m or balance sheet ≤ €129m | European Commission, Omnibus IV, 21 May 2025 |
| Small mid-cap (provisional trilogue) | Fewer than 1,000 employees; turnover ≤ €200m or assets ≤ €172m | Council / Parliament provisional agreement |
| Mid-cap | 250 to 3,000 employees | EIB |
| Mid-market transaction | Equity value €15m to €500m | Argos Index / Epsilon Research |
| Lower mid-market (PE) | Equity tickets €15m to €50m | Invest Europe |
The Commission estimated its original 250 to 749 employee bracket at roughly 40,000 companies across Europe.
For the purposes of this report, the European mid-market refers to established, profitable, mostly private businesses with revenues of approximately €20 million to €500 million, sufficient trading history to be assessed on realised earnings rather than projections, and no independent access to public debt or equity markets. The lower mid-market refers to the €20 million to €75 million revenue band within that group, where transaction economics are tightest.
Three distinctions matter throughout. Micro and small businesses face a credit problem that is well documented and reasonably well served by banks and public guarantee schemes. Large listed corporates hold direct access to bond markets, syndicated facilities and equity issuance. The mid-market holds neither the simplicity of the first nor the optionality of the second, and it is that intermediate position, not size alone, that generates the mismatch this report examines.
01EUrope's capital market paradox
The macro picture entering the second half of 2026 is unusual, and readers should be careful not to read 2026 through a 2024 lens. The ECB cut its deposit facility rate to 2.00% by mid-2025 and held it there through the first months of 2026. On 11 June 2026 it raised all three key policy rates by 25 basis points, taking the deposit rate to 2.25%, its first increase since 2023, in response to an energy-driven inflation shock connected to the conflict in the Middle East. Euro area inflation had reached 3.2% in May 2026, the highest reading since September 2023. The Governing Council held in July and meets again on 10 September 2026. The disinflation-and-easing narrative that framed European corporate finance planning through 2025 no longer describes the environment.
Against that backdrop the aggregate data look healthy.
| Measure | Volume (deal count) | Value |
|---|---|---|
| EMEA M&A, H1 2026 | 9,445 deals, -10.0% y/y | €783bn, +51.8% y/y |
| EMEA private equity buyouts, H1 2026 | 1,564 deals, -10.1% y/y | €165bn, +25.4% y/y |
| Mean EMEA buyout size, H1 2026 | n/a | €111m, +41% y/y |
| Q2 2026 buyout count | 711, lowest quarterly total in years | n/a |
The same pattern recurs wherever the data allow a split between count and value. Equity issuance recovered sharply in headline terms: European IPO proceeds reached €7.2 billion in the first half of 2026, up 76% year on year according to PwC's IPO Watch EMEA. That figure sits against $178 billion of global IPO proceeds over the same period, and in the first quarter three defence-related listings alone raised €3.8 billion, representing 83% of all European IPO proceeds for the quarter. A market can be described as recovering and remain, for practical purposes, closed to anything outside a narrow band of currently favoured assets.
Private capital tells a similar story. Invest Europe recorded €147 billion of European private equity and venture capital fundraising in 2025, up 16% and second only to 2022, with buyout funds accounting for €103 billion of that total after a 33% increase. North American investors supplied close to 30% of buyout fundraising. Investment reached €135 billion across 8,457 companies. Fundraising, however, concentrated among fewer and larger funds, and the capital raised at the top of the market does not deploy at the bottom of it.
Bank credit is the clearest case. Euro area adjusted lending to non-financial corporations accelerated through 2026, from 2.9% annual growth in February to 4.4% in July, the strongest expansion in three years. Read alone, that series would suggest broad-based credit normalisation. It does not describe what mid-market borrowers are experiencing, and Section 02 explains why.
The paradox, stated precisely, is this. European capital formation is functioning at the level of the market and malfunctioning at the level of the median company. Aggregate statistics measure euros deployed. Companies experience processes completed. When the same quantum of capital is delivered through fewer, larger transactions, aggregate health and company-level difficulty are not contradictory findings. They are the same finding viewed from two ends.
02Where the financing gap actually exists
The most direct evidence sits in the ECB's Survey on the Access to Finance of Enterprises. The 39th round, conducted between 21 May and 26 June 2026 across 5,087 euro area firms, recorded a divergence by firm size that had not been present in earlier rounds of the current cycle.
| Indicator (net % of respondents) | SMEs | Large firms |
|---|---|---|
| Change in bank loan availability | -4 | +4 |
| Bank loan financing gap (positive = widening) | +5 | +1 |
| Banks' willingness to lend | +2 | +12 |
| Own capital position supporting access to finance | +4 | +11 |
| Change in turnover | +3 | +20 |
| Change in profits | -17 | -13 |
| Change in fixed investment | +4 | +10 |
| Expected fixed investment, Q3 2026 | +4 | +17 |
| Reported increase in bank loan interest rates | 43 | 41 |
| Share applying for a bank loan (% of respondents) | 19 | 29 |
Three features of this table are worth isolating. Availability moved in opposite directions by size class, with SMEs reporting a further decline while large firms reported an improvement. Banks' willingness to lend improved four times as much for large firms as for SMEs, and the SME reading actually deteriorated from the previous quarter. Interest rate increases, by contrast, were reported almost identically across the size distribution at a net 43% and 41%. Price is converging. Access is diverging.
The pricing data confirm this and are the single most instructive series in the report.
| Category | Rate, Jul 2026 | New business volume, Jul 2026 | New business volume, Jul 2025 | Change |
|---|---|---|---|---|
| Loans over €1m, floating rate, i.r.f. ≤ 3 months | 3.49% | €169.40bn | €152.23bn | +11.3% |
| Loans up to €250,000, floating rate, i.r.f. ≤ 3 months | 3.83% | €27.84bn | €28.22bn | -1.3% |
| Sole proprietors and unincorporated partnerships, i.r.f. ≤ 1 year | 4.29% | €2.46bn | €2.96bn | -16.9% |
| Composite cost-of-borrowing indicator, all corporate loans | 3.80% | €324.58bn | €300.66bn | +8.0% |
The 4.4% acceleration in euro area corporate credit growth is almost entirely a large-ticket phenomenon. New lending above €1 million grew by more than €17 billion a month year on year. New lending below €250,000 shrank. The premium charged on small tickets is 34 basis points, which is not a punitive spread by any historical standard. Banks are not pricing smaller borrowers out. They are originating fewer transactions with them, which is a different problem and requires a different response.
That distinction has consequences for how the gap should be characterised. This is not a credit crunch. Only 5% of euro area firms that considered a bank loan relevant reported obstacles to obtaining one in the second quarter of 2026, down from 6%, and discouraged borrowers held at 3%. The share of financially vulnerable firms was 4%. The July 2026 bank lending survey recorded a net 7% tightening of credit standards for loans to firms, below the historical average of 8% and materially below the net 19% that banks themselves had forecast in April. Vanilla senior debt for a solvent mid-market company remains obtainable.
The constraint bites elsewhere. It bites when the requirement is not a working capital facility but growth capital, an acquisition line, a shareholder recapitalisation, a succession solution or a structured instrument sized between €5 million and €50 million. That is the layer where bank product design stops, where private credit funds begin to find tickets uneconomic, and where private equity mandates have been migrating upward. Invest Europe recorded the mid-market at 34% of total European buyout investment in 2025, with the lower mid-market (equity tickets of €15 million to €50 million) at €12.5 billion across 419 transactions and the core mid-market at €10.9 billion. Those are real numbers, but they are a minority share of an asset class whose average deal size rose 41% in a single year.
The ECB's data on how firms intend to finance artificial intelligence investment over the next twelve months illustrate the practical consequence. Among firms planning such investment, 72% expect to use internal funds, 16% bank loans, 16% grants, 15% leasing, 6% private equity or venture capital and 1% debt securities. A continent debating how to finance a technological transition is watching its companies plan to fund it from retained earnings.
03The mid-market's structural disadvantage
The mid-market's position is awkward for reasons that are structural rather than cyclical, and understanding them requires looking at the cost side of the investor's business rather than the borrower's.
Institutional underwriting has a substantial fixed-cost component. Legal, financial, tax, commercial and increasingly technical and ESG diligence consume broadly similar absolute resources on a €30 million transaction as on a €150 million one. Investment committee time is not proportional to cheque size. Where an investor faces more opportunities than capacity, and Section 04 shows they do, the rational response is to move up the size curve. The mean EMEA buyout size rising 41% in a year while counts fell 10% is precisely what that behaviour looks like in aggregate data.
A second structural feature is informational. Larger companies produce audited consolidated accounts on a fixed calendar, maintain treasury and investor relations functions, carry credit ratings and have transacted before. Their disclosure is standardised, which means an investor can assess them against a known template at low marginal cost. Mid-market companies are frequently owner-managed, report to national GAAP with limited management information beyond statutory requirements, hold accounting policies shaped by tax rather than transaction considerations, and have never run a process. None of this makes them worse businesses. It makes them more expensive to evaluate, and expense of evaluation, in a capacity-constrained market, converts directly into reduced investor coverage.
Fragmentation compounds both. The EIB Investment Report 2025/2026 found that 62% of EU firms have difficulty exporting to other EU member states because of divergent rules and regulations, and estimated that removing those barriers could raise the ratio of firm investment to assets by around 10%. For a mid-market company the practical effect is that its addressable market, and therefore its growth narrative, is constrained by frictions a multinational absorbs through scale. Earlier EIB analysis found that the probability of a firm issuing equity relates not to national GDP per capita but to the size, depth and integration of the financial market it sits in, and that firms able to issue equity to fund new products grow around 7 percentage points faster than those that cannot.
It would be wrong to conclude that all mid-market companies face this equally. The evidence points to a set of characteristics that determine which businesses inside the segment are readily financeable and which are not.
More financeable: recurring or contracted revenue with demonstrable retention; audited accounts with a clean three-year history and consistent policies; management depth beyond the founder; a defensible position in a definable niche; capital expenditure that is predictable; and a use of proceeds that maps to an identifiable return.
Less financeable: revenue concentrated in a small number of renewable contracts; EBITDA that requires extensive normalisation to reach the headline figure; a single principal who holds the customer relationships, the strategy and the operating knowledge; exposure to input cost volatility without pricing power; and a capital request framed as a general funding requirement rather than a specific investment case.
The distinction is not fundamentally about quality. It is about the ratio of underwriting effort to underwriting confidence, and it is largely within a company's control.
04Investor selectivity has changed the equation
Investor selectivity is a term that is used loosely. The useful question is what mechanism produces it and how it shows up in executed transactions.
The mechanism is liquidity. Bain's Global Private Equity Report 2026 records approximately 32,000 unsold portfolio companies globally, carrying around $3.8 trillion of value. Average holding periods at exit have extended to roughly seven years against five to six years across 2010 to 2021. Almost 40% of portfolio companies are now held beyond five years, up from 29% in 2019. Distributions have remained below 15% of net asset value for four consecutive years, an industry record. Invest Europe recorded European continuation fund fundraising of €19.8 billion in 2025, more than double the €9.3 billion raised in 2024, which is the market's own admission that a large cohort of assets cannot currently clear at acceptable prices through conventional routes.
A general partner in that position is not short of money. Global buyout dry powder sits at roughly $1.3 trillion. What that general partner is short of is realisations, and the constraint on new commitments therefore runs through investment committees rather than through fund balance sheets. Committees that cannot demonstrate exits become conservative about entries, and conservatism expresses itself as a higher evidentiary bar rather than as a refusal to transact.
The valuation data show what that bar produces.
| Quarter | Index (median EV/EBITDA) | Paid by funds | Paid by strategic buyers | Deals below 7.0x | Deals above 15x |
|---|---|---|---|---|---|
| Q4 2024 | 9.8x | n/a | n/a | n/a | n/a |
| Q1 2025 | 9.5x | 10.0x | 9.2x | 23% | 9% |
| Q2 2025 | 9.2x | 10.0x | 8.5x | n/a | n/a |
| Q3 2025 | 8.7x | n/a | n/a | 28% | n/a |
| Q4 2025 | 8.3x | n/a | 7.7x | 27% | 7% |
| Q1 2026 | 8.6x | 10.0x | 7.8x | 22% | 6% |
| Q2 2026 | 8.8x | 10.2x | 7.9x | 27% | 5% |
The headline recovery from 8.3x to 8.8x across two quarters is real but is not a broad repricing. The gap between what funds pay and what corporates pay widened to 2.3 turns of EBITDA. The share of transactions clearing below 7.0x rose back to 27% in the second quarter of 2026 after falling to 22% in the first. The share clearing above 15x fell to 5%, a historical low. The market is compressing its upper tail and thickening its lower one while the median drifts upward, which is the signature of a market sorting assets rather than repricing them.
Argos also reports that the average EBITDA margin of companies in its sample fell to 12.6% in the first quarter of 2026, against 13.4% in the second half of 2025 and 17.4% in the second half of 2024. Read alongside the multiple data, this suggests buyers are transacting on a wider range of asset quality but pricing that range far more sharply than they did two years ago. Selectivity is not showing up as fewer buyers. It is showing up as wider outcomes for similar-looking businesses.
Private credit follows the same shape. European direct lending recorded 494 transactions in the first half of 2026, up 4% year on year, but market participants describe accelerating bifurcation, with high-quality assets attracting competitive processes while others face longer timelines and more demanding diligence. The Argos data note that mid-market M&A volumes in the eurozone fell 8% quarter on quarter in the second quarter of 2026 while the leveraged buyout share of activity held steady at 14% by count and 32% by value.
The counterargument
There is a serious case that this is not a market failure at all, and it deserves to be addressed rather than acknowledged in passing.
The case runs as follows. Capital allocators have spent four years being taught that they overpaid between 2020 and 2022, and the 32,000 unsold companies are the evidence. If they are now requiring higher quality of earnings, tighter revenue visibility and clearer paths to exit before committing, that is not a gap in the market. It is the market working. On this reading, businesses that cannot attract capital on acceptable terms are, for the most part, businesses that do not offer sufficiently attractive risk-adjusted returns, and describing that as a financing gap mistakes a pricing signal for a market defect.
Elements of the ECB's own data support this position. Financing obstacles are at 5%, near historic lows. Only 4% of euro area firms are financially vulnerable. The single most cited reason for not applying for a bank loan is that internal funds are sufficient, given by 45% of respondents. Most tellingly, when firms were asked whether access to finance was a major concern, 25% said yes, and large firms cited it more often than SMEs, at 29% against 23%. If SMEs were being systematically starved of capital, that ordering should not appear. Olivier Blanchard's critique of the Draghi report makes the macro version of the same argument, noting that EU investment runs at roughly 22% of GDP, close to the United States, and that framing the problem as one of mobilising savings is therefore misleading.
The evidence does not permit a clean rebuttal, and this report does not offer one. What it does permit is a narrowing of the claim.
The selectivity argument explains the level of investor caution. It does not explain the divergence by firm size occurring at constant price. If mid-market businesses were simply worse investments, the market would express that through wider spreads. Instead the small-ticket premium is 34 basis points while small-ticket volumes contract and large-ticket volumes expand by 11%. It also does not explain why the 2.3-turn valuation gap between financial and strategic buyers has persisted across three quarters in the same size cohort, or why 27% of transactions clear below 7.0x in the same quarter that funds are paying 10.2x. Those are not the fingerprints of a market that has finished pricing risk. They are the fingerprints of a market in which similar assets reach materially different audiences.
The honest formulation is therefore narrower than the popular one. Some of the capital gap is a quality gap and should not be financed away. A meaningful residual is a matching and information gap, and it is the residual that is addressable.
05The capital-structure mismatch
Companies commonly approach fundraising as a quantum question. The more consequential question is which instrument, because the instrument determines the constraint the business will operate under for the following five to seven years.
| Layer | Typical provider | Relative cost | Dilution | Control impact | Best suited to |
|---|---|---|---|---|---|
| Senior secured debt | Domestic and regional banks | Lowest | None | Covenants, security | Predictable cash flows, asset backing, refinancing |
| Unitranche / direct lending | Private credit funds | Moderate | None | Covenants, information rights | Acquisitions, sponsor-backed growth, speed and certainty |
| Subordinated / mezzanine | Specialist credit, insurers | Higher | Limited (warrants) | Light, incurrence-based | Bridging a gap without ceding equity control |
| Structured / preferred equity | Hybrid and special situations funds | Higher | Structural | Negotiated protections | Shareholder liquidity, balance-sheet repair, non-standard situations |
| Minority growth equity | Growth funds, family offices | Highest nominal | Yes, minority | Board seat, reserved matters | Scaling with retained founder control |
| Majority buyout | Private equity | Highest nominal | Yes, majority | Control transfers | Succession, full or partial exit, institutionalisation |
| Strategic investment | Corporate acquirers, corporate venture | Variable | Yes | Commercial dependency | Market access, channel or technology partnership |
Selecting the wrong layer produces predictable failures. A company with genuine growth requirements but volatile cash conversion that funds itself with senior amortising debt will meet its covenants at the expense of its investment plan. A profitable, slow-growing business that raises minority growth equity from a fund underwriting a five-year exit has imported an exit obligation it has no realistic means of satisfying, and will spend the second half of the holding period managing an investor whose objectives have diverged from its own. A shareholder seeking partial liquidity who runs a full sale process to achieve it may find they have surrendered control to solve a problem that structured or preferred capital could have addressed while preserving it.
The mismatch also propagates. A company that takes a full-priced minority round on aggressive projections and then misses them has established a valuation reference and a performance record that will price its next round, and it will be raising that round from a smaller universe. A capital structure that is over-levered relative to sector norms will be flagged in the first hour of any subsequent diligence, constraining both the acquisitions the business can make and the investors willing to look at it.
Instrument selection is therefore a strategic decision rather than a procurement decision, and it should precede the approach to market. A company that arrives with a defined requirement and a reasoned view on structure is asking the investor to underwrite a narrower question, and narrower questions are answered faster.
06The investability premium
The following framework is an analytical construct developed by KH Holdings for this report. It is not an established academic or industry term, and it should be read as a hypothesis consistent with the evidence rather than as a measured quantity.
The Investability Premium is the difference in investor appetite, financing terms and transaction outcomes between two businesses with materially similar underlying fundamentals but materially different levels of preparation, positioning, transparency and institutional readiness.
The framework rests on a specific claim about where the constraint sits. As set out in Section 04, capital allocators in 2026 are constrained by underwriting and committee capacity rather than by available funds. Where capacity is the constraint, anything that reduces the cost of reaching conviction has value to the investor, and value to the investor is convertible into terms for the company.
The mechanism operates at identifiable points in a transaction.
| Stage | Effect of preparation | Observable consequence |
|---|---|---|
| Targeting | Approach limited to investors whose mandate, ticket size and sector focus genuinely fit | Higher conversion from approach to engagement; fewer wasted processes |
| Screening | Investment case legible on first read; questions anticipated | Progression to a second meeting rather than a polite decline |
| Underwriting | Quality of earnings, KPIs and forecasts stand up without reconstruction | Fewer discovered issues; less price chipping |
| Competitive tension | Multiple credible parties reach committee within a comparable window | Terms set by competition rather than by a single counterparty |
| Documentation | Clean corporate records, resolved contingencies, prepared management | Shorter exclusivity, narrower warranty and indemnity positions |
| Post-signing | Investor's underwriting case matches operating reality | Fewer earn-out disputes; smoother subsequent rounds |
Two claims should be stated carefully. Preparation does not create value that the business does not possess, and it does not automatically produce a higher headline multiple. A well-prepared business with structural weaknesses will be well-prepared and correctly discounted. The dispersion visible in the Argos data, where 27% of transactions clear below 7.0x in a quarter when funds are paying 10.2x, is partly a quality distribution and partly something else.
What the evidence does support is that preparation acts on the variance of outcomes rather than principally on the mean. It reduces the probability of the tail outcomes that destroy transactions: the process that runs eleven months and closes at a discount, the diligence finding that resets price after exclusivity, the approach to thirty investors of whom four had a relevant mandate. In a market where the difference between a strategic buyer's 7.9x and a fund's 10.2x for comparable assets has persisted for three quarters, reaching the correct audience is not a marginal consideration.
07What investor readiness really means
Investor readiness is frequently reduced to document preparation. Document preparation is the last of its components and the least differentiating.
Financial readiness means that reported EBITDA survives contact with a quality of earnings analysis. In practice this means adjustments that are documented and defensible rather than asserted, revenue recognition policies that a buyer's accountants will not need to restate, working capital that has been analysed for seasonality and normalised, and management accounts that reconcile to statutory accounts without a bridging exercise. Where 27% of European mid-market transactions are clearing below 7.0x EBITDA, the definition of the EBITDA in question is not a technicality.
Strategic clarity means the business can articulate what the capital is for and what it will produce, in terms that connect to the investor's return model. A request for growth capital that cannot be decomposed into specific uses with specific expected returns is being asked to be underwritten on trust, and trust is the most expensive input in a capacity-constrained market.
Valuation discipline means holding a defensible view of what the business is worth and why, referenced to observable transaction evidence rather than to aspiration. In the current environment this requires acknowledging that the reference set has moved: the eurozone mid-market median stood at 9.8x in the fourth quarter of 2024 and 8.8x in the second quarter of 2026, and strategic buyers have been paying below 8x throughout. Vendor price expectations that have not adjusted are, on the Argos commentary, one of the identifiable causes of transaction failure through this period.
Transaction readiness means the diligence answer exists before the question is asked. Corporate records complete, share registers clean, material contracts assembled with change-of-control provisions identified, litigation and tax contingencies resolved or quantified, and a data room structured to the sequence in which an investor will actually work rather than to the company's internal filing logic.
Investor positioning is where the largest and least recognised gains sit. The relevant investor universe for a specific European mid-market business is rarely more than fifteen to thirty institutions once mandate, ticket size, sector coverage, geography, structure and current fund vintage are applied. Broad distribution to a wide universe signals that this analysis has not been done, and it consumes the company's credibility with the small number of parties who mattered.
Management readiness means the leadership team can present the investment case, defend the forecast under adversarial questioning, and demonstrate that the business does not depend entirely on one individual. Key-person concentration is among the most common findings that reduce price or introduce structure in lower mid-market transactions, and it is among the most addressable, given sufficient lead time.
The common thread is that each of these reduces the investor's cost of reaching a decision. That is the mechanism by which readiness translates into terms.
08What comes next for European mid-market capital
Forecasting is difficult in the current environment and the honest position is that the rate path is genuinely uncertain. The ECB's June 2026 projections put headline inflation at 3.0% in 2026, 2.3% in 2027 and 2.0% in 2028, but those projections were made before the full second-round effects of the energy shock were observable, and the Governing Council's own July minutes indicated that the pause should not be read as the end of the tightening cycle. Companies planning transactions over the next twelve months should not assume a return to the 2025 easing path.
Several developments look more predictable.
The exit backlog will continue to force activity. With 32,000 unsold portfolio companies globally, holding periods near seven years and distributions suppressed for a fourth year, general partners face structural pressure to transact. Continuation vehicles have absorbed part of this, with European fundraising for such vehicles reaching €19.8 billion in 2025, but they are a deferral rather than a resolution. The practical implication for mid-market companies is a rising supply of sponsor-owned assets coming to market over the next 12 to 24 months, which increases competition for buyer attention and raises the return on being ready when a window opens.
Private credit will continue to take share in the mid-market, though the pace is contested. European private credit assets under management have passed €400 billion, direct lending transaction counts grew 4% in the first half of 2026, and the retreat of bank balance sheets from mid-market cash-flow lending is a structural rather than cyclical feature. Direct lenders are also extending into asset-backed structures, which broadens the range of mid-market situations they can address. Whether spreads compress as capital accumulates, and what that does to underwriting standards, is an open question that will matter more in 2027 than in 2026.
Policy is moving but slowly, and should not be built into a two-year financing plan. The Savings and Investments Union has produced a Council position on securitisation reform and a negotiating stance on the pan-European pension product, and the Commission has set an end-2026 target for completion. The prize is real: only 1.9% of outstanding EU loans are currently securitised, against roughly 7% in the United States, and closing part of that gap would free bank capacity for exactly the lending that is currently contracting. A year after publication, however, only around 11% of the Draghi report's recommendations had been acted on. The small mid-cap definition is provisionally agreed but not yet in force. These are 2027 and 2028 effects at the earliest.
Cross-border capital will remain important and remain asymmetric. North American investors supplied close to 30% of European buyout fundraising in 2025. International investors underwrite from a distance and therefore require more standardised, better documented opportunities than a domestic bank relationship manager does. The growing share of foreign capital in European private markets raises, rather than lowers, the preparation threshold for companies seeking to access it.
Conclusion
If Europe has capital, why do so many companies still struggle to access the right capital?
The evidence assembled here suggests the answer is not scarcity. Aggregate deployment is at or near record levels across M&A value, private equity fundraising, private credit assets and corporate bank lending growth. It is not, principally, price either: 34 basis points separates small-ticket from large-ticket euro area corporate lending, and the recovery in mid-market valuations from 8.3x to 8.8x indicates a functioning, if selective, market for control.
The answer is that the same quantity of capital is now being delivered through a smaller number of larger, better-documented transactions, and that the segment least able to meet that documentation and scale threshold sits between €20 million and €500 million of revenue. Deal counts fell 10% while values rose 51.8%. New lending above €1 million grew 11.3% while new lending below €250,000 fell. SMEs reported deteriorating loan availability in the same quarter that large firms reported improvement. Funds paid 10.2x while strategic buyers paid 7.9x for companies drawn from the same size cohort.
Part of that dispersion is a quality signal and should be respected as such. Investors that overpaid between 2020 and 2022 are entitled to require better evidence now, and businesses that cannot generate adequate risk-adjusted returns should not be financed as though they could. But quality does not explain divergence at constant price, and it does not explain why comparable assets reach such different audiences. What remains after the quality explanation is exhausted is a matching problem, and matching problems respond to preparation, positioning and execution in a way that scarcity does not.
For a mid-market company, the operational conclusion is narrow. The binding constraint on the investor's side is underwriting capacity, not capital. The company that is cheapest to underwrite, most clearly matched to the instrument it is asking for, and presented to the fifteen institutions whose mandate actually fits rather than to the hundred that might, is competing for a resource that is genuinely scarce. That is a different exercise from raising money, and it is the exercise that determines outcomes in a market shaped like this one.
The capital gap in Europe is real. It is largely not a gap in the supply of capital.
KH Holdings publishes research on European capital markets, corporate finance and the mid-market. This publication is provided for information purposes only. It does not constitute investment, legal, tax or financial advice, and should not be relied upon as a recommendation in relation to any transaction.
Sources
Primary institutional sources
- European Central Bank, Survey on the Access to Finance of Enterprises in the euro area, second quarter of 2026 (39th round), 20 July 2026. ecb.europa.eu ↗
- European Central Bank, Survey on the Access to Finance of Enterprises in the euro area, first quarter of 2026 (38th round), 27 April 2026. ecb.europa.eu ↗
- European Central Bank, Euro area bank interest rate statistics: July 2026, 2 September 2026. ecb.europa.eu ↗
- European Central Bank, The euro area bank lending survey, second quarter of 2026, 21 July 2026. ecb.europa.eu ↗
- European Central Bank, Monetary developments in the euro area: July 2026. ecb.europa.eu ↗
- European Central Bank, Monetary policy decisions, 11 June 2026. ecb.europa.eu ↗
- European Investment Bank, EIB Investment Report 2025/2026: Capitalising on Europe's Strengths. eib.org ↗
- European Investment Bank, EIB Investment Survey 2025: European Union overview. eib.org ↗
- European Investment Fund, EIF Equity Survey 2025. eif.org ↗
- European Commission, Commission Staff Working Document accompanying the proposal on small mid-cap enterprises, SWD(2025) 501 final, 21 May 2025. eur-lex.europa.eu ↗
- Council of the European Union, Savings and Investments Union. consilium.europa.eu ↗
Market data and transaction sources
- Mergermarket / ION Analytics, Deal Drivers: EMEA HY 2026, 18 August 2026. ionanalytics.com ↗
- Invest Europe, Investing in Europe: Private Equity Activity 2025, 7 May 2026. investeurope.eu ↗
- Argos / Epsilon Research, Mid-market Argos Index® Q2 2026, 3 September 2026. argos.fund ↗
- Argos / Epsilon Research, Mid-market Argos Index® Q1 2026, 20 May 2026. argos.fund ↗
- Argos / Epsilon Research, Mid-market Argos Index® Q4 2025, 18 February 2026. argos.fund ↗
- PwC, IPO Watch EMEA H1 2026, July 2026. pwc.co.uk ↗
- Bain & Company, Global Private Equity Report 2026. bain.com ↗
- Octus, EMEA Private Credit Review H1 2026. octus.com ↗
Policy analysis
- M. Draghi, The future of European competitiveness, European Commission, September 2024.
- O. Blanchard, Essential issues raised, but not fully answered by the Draghi report, Peterson Institute for International Economics. piie.com ↗
- All figures accessed and verified 7 September 2026. Where a secondary source cited institutional data, the underlying primary publication has been used.
Preparing to raise capital?
We help mid-market businesses become cheap to underwrite, matched to the right instrument, and presented to the investors whose mandate actually fits.